Activity design: step zero
Sometime ago web•TrainSim opened an old hobby magazine to see an article in there about a method of scheduling trains on a model railway. So here's step zero towards designing an activity for MSTS.
Required tools:
- graph paper,
- paper for notes,
- set of colouring pencils,
- eraser,
- ruler, and,
- 1 x black lead pencil (if 2 x black lead pencils, a ruler is not needed); Or:
- spreadsheet program with charting capability.
Where & when plot
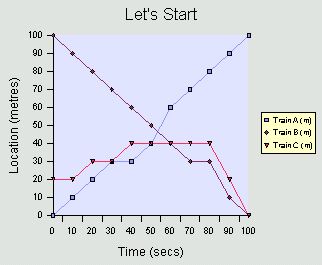
We're going to plot a simple graph of train position against time. Use only units such as metres and seconds for the time being - hour, minutes and kilometres per hour, for example, will only complicate matters and not bring out what the graph can show. There'll be plenty of time later to be more realistic with a practical application. Note that plotting the position of a train in this manner assumes the train moves with a constant speed over the period of time of the plot, another simplification of reality.
If you're using graph paper and pencil, place points on your graph to represent the position of a train at a certain time. Join the points to be able to read a train's position at any time.
For spreadsheet users, you'll need to firstly set up a table which gives the position of a train at a certain time. Then you can get your graph of train position against time.
Now let's see what our graph tells us.
This is the spreadsheet table of data used to produce the graph above:
| Time (secs) | Train A (m) | Train B (m) | Train C (m) |
|---|
| 0 | 0 | 100 | 20 |
| 10 | 10 | 90 | 20 |
| 20 | 20 | 80 | 30 |
| 30 | 30 | 70 | 30 |
| 40 | 30 | 60 | 40 |
| 50 | 40 | 50 | 40 |
| 60 | 60 | 40 | 40 |
| 70 | 70 | 30 | 40 |
| 80 | 80 | 30 | 40 |
| 90 | 90 | 10 | 20 |
| 100 | 100 | 0 | 0 |
Here are some things to notice from the graph and table:
Any time that a train is at the same position for a length of time, it must be stationary E.g., Train A from time 30 secs to time 40 secs.
There are several occasions where 2 or more trains are at the same location at the same time (bolded in the table).
At time 55 secs, our graph shows trains A & C are at the same location (that's the reason for a graph).
Now we can deduct some characteristics about our railway on which to run Trains A, B and C:
- we need a passing siding or double track at location 30 metres (A & C are there at the same time);
- we need a passing siding or double track at location 40 metres;
- we need a passing siding or double track between location 40 metres and location 50 metres so A & C can cross.
|